

Home > CALC3RD > Chapter Ch1 > Lesson 1.2.4 > Problem 1-75
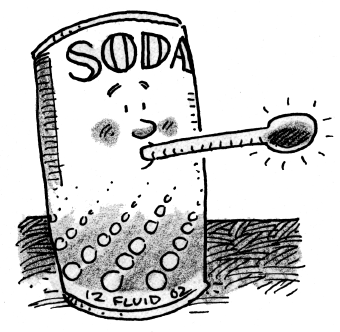
A can of soda is
Time (min) | |||||||
Temp. ( |
Sketch a graph of this situation.
First plot the data. Then connect the points as smoothly as possible. How do we know that this will be a continuous graph?
When is the temperature changing the fastest? How can you see this on the graph?
Consider the relationship between rates of change and slope. Between which two points is the slope the greatest?
Approximately how fast is the temperature changing during the first
minutes? How can you tell?
Use the eTool below to view the graph.
Click the link at right for the full version of the eTool: Calc 1-75 HW eTool