

Home > MC2 > Chapter 1 > Lesson 1.1.4 > Problem 1-28
Audrey made the histogram below to show her recent bowling scores.
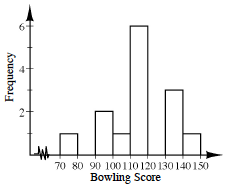
How many games did she play in total?
Each bar height represents the frequency and tells you how many games had a score that fell between the lower and upper value of that bar. For example,
game had a score that fell between and . Try to add up all the frequencies to find the total number of games. Between what two values did most of her scores fall?
Which bar is the tallest?
Which scores do these bars represent?Between what score range do at least half of her games fall?
Examine the graph around the tallest bars to see where the range of bars is where most of the score values fall.Most of Audrey's scores were between
and . What portion of her scores fell between
and ? Examine the bar highlighted in the graph representing the games played with scores between
and .
How many games were played in this interval?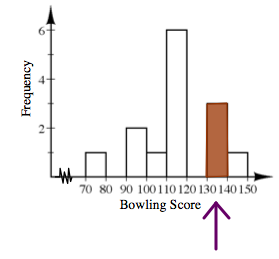
out of the total scores fall between and .
This can be written as: