

Home > CC2 > Chapter Ch1 > Lesson 1.2.1 > Problem 1-62
Craig is practicing his baseball pitching. He kept track of the speed of each of his throws yesterday, and made the histogram at right. 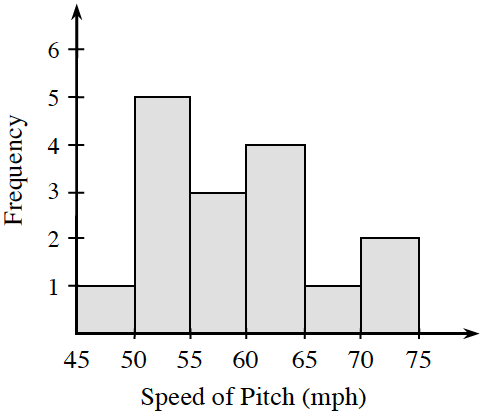
Can you tell the speed of Craig’s fastest pitch? Explain.
When looking at the intervals of the fastest pitch speeds, can you tell the exact mph of his pitches or do the bars just tell you how many pitches were thrown in a certain mph range?
Between what speeds does Craig usually pitch?
Examine the graph around the tallest bars to see the range of speed where most of Craig's throws lie.
Which bar frequencies add up to more than half of his total throws?
Which speed intervals do these bars represent?Possible answers:
mph
mph Based on this data, what is the probability that Craig will pitch the ball between
and miles per hour? How many of Craig's pitches were between
and mph? How many pitches did Craig throw in total?