

Home > CC2 > Chapter Ch7 > Lesson 7.1.6 > Problem 7-74
Mt. Rose Middle School collected canned food to donate to a local charity. Each classroom kept track of how many cans it collected. The number of cans in each room were
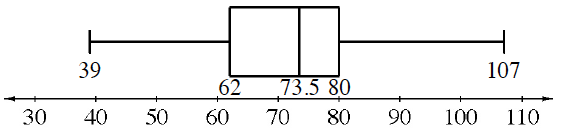
What is the interquartile range of the data?
The main office staff collected
cans, the counseling staff collected cans, and the custodial staff collected cans. On grid paper, make a new box plot that includes this data. Clearly label the median and the first and third quartiles
If the data points
, , and are added, how does the entire data set change as a result? Reorganize the data with the new points and find the median and the lower and upper quartiles. Then try creating your own plot. Remember, the median is the middle value that divides the upper and lower halves. The lower quartile is the middle value of the lower half of the data, while the upper quartile is the middle value of the upper half of the data.