Home > CC3 > Chapter Ch1 > Lesson 1.2.1 > Problem 1-48
Jerome is keeping track of how many books he and his friends have read during the first
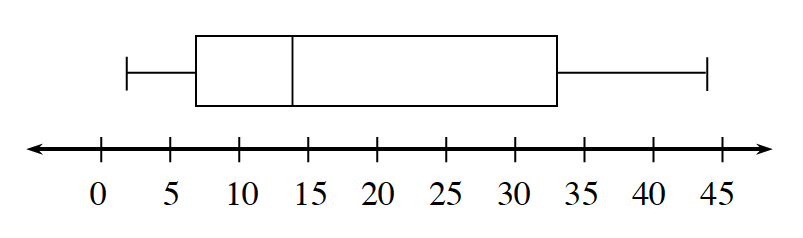
Box Plots
A box plot (also known as a box-and-whisker plot) displays a summary of data using the median, quartiles, and extremes of the data. The box contains “the middle half” of the data. The right segment represents the top
To construct a box plot using a number line that shows the range of the data, draw vertical line segments above the median, first quartile and third quartile. Then connect the lines from the first and third quartiles to form a rectangle. Place a vertical line segment above the number line at the highest and lowest data values. Connect the minimum value to the first quartile and the maximum value to the third quartile using horizontal segments. For the data set used in the Quartile Math Note, namely,