Home > CC3 > Chapter Ch6 > Lesson 6.1.1 > Problem 6-6
Find the rule for the pattern represented below.
Tile | Tile | Tile | Tile | Tile | Tile |
Tile | Tile | Tile | Tile | Tile |
Figure 1
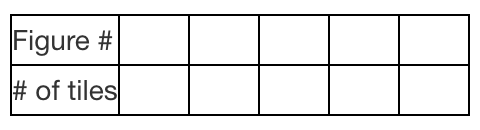
Create a table to help find a pattern. Table: 2 rows, 6 columns. First column labeled as follows: Row 1, Figure number. Row 2, number of tiles
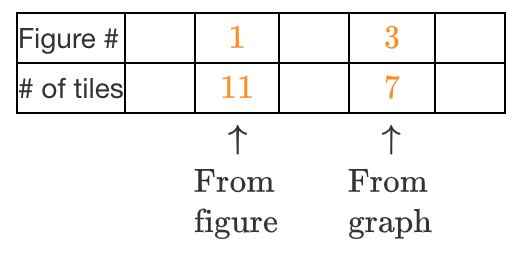
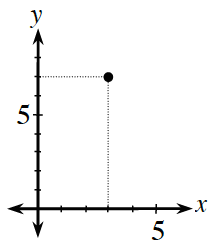
Fill in the information that you are given. Added to table: Column 3: 1 and 11, with note, From Figure. Column 5: 3 & 7, with note, From Graph.
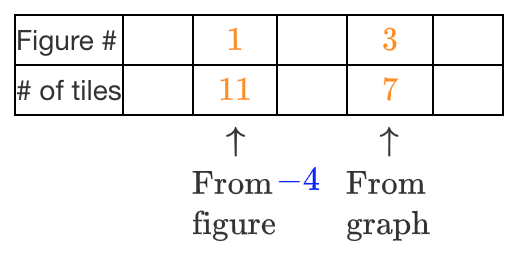
What is the difference between the number of tiles in the two figures? Added to table below row 2: Minus 4 under column 4.
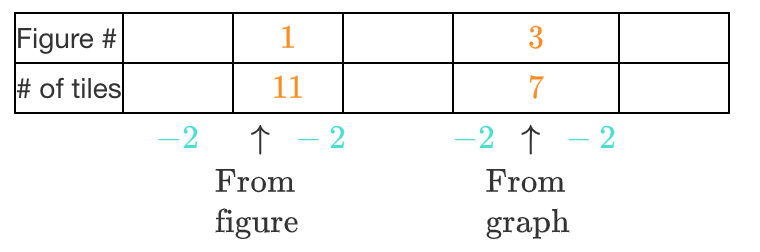
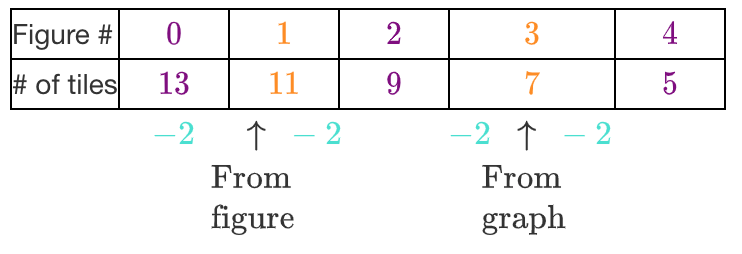
Use this information to find the difference between the number of tiles in consecutive figures. Added to table below row 2: Minus 2 between each of the columns 2 & 3, 3 & 4, 4 & 5, 5 & 6.
Now fill in the rest of the table. Added to table: Column 2, 0 & 13, Column 4, 2 & 9. Column 6, 4 & 5.
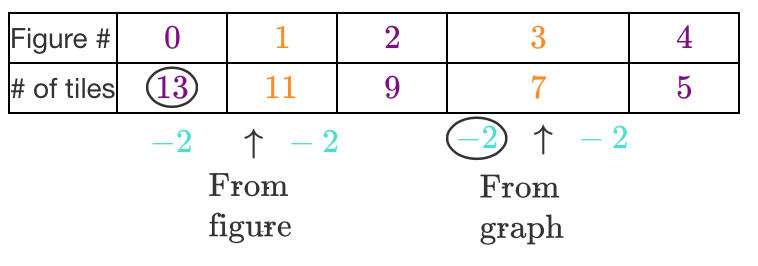
Using the starting point and the growth rate, write an equation to represent the pattern. Added to table are circles on the 13 in the 2nd row 2nd column, and on the third minus 2, below the table.