

Home > CCA > Chapter Ch11 > Lesson 11.3.2 > Problem 11-88
Kelly is an engineer for a non-profit company that drills wells for impoverished villages in Africa. The cost of drilling a new water well is determined from the amount of drilling needed to find water, plus the fixed costs of the pump. Kelly has collected data on cost versus well depth for a sample of
LSRL
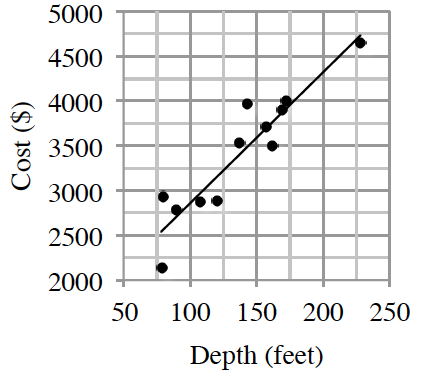
Discuss the form, strength, direction and outliers.
Is the data in a line, a curve, or has no pattern? Does it go up, or does is go down?
Do most of the points fall close to the pattern? Are there any outliers?
Interpret the slope of the least squares regression line in the context of this study.
Recall that slope is
. What does the -axis represent? What does the -axis?
Calculate and interpret
-squared in context. R-squared:
(Note that is given.) What does this mean in the context of the situation?
What does the
-intercept represent in this analysis? The
-intercept is the point where . What is the cost to drill feet?
Using the LSRL model, estimate the cost of wells that are
, and feet. Substitute
, and for in the equation of the line.
The
-foot well Kelly measured has a residual of . What was the actual cost of the well? Take the predicted cost of an
foot well, then add .
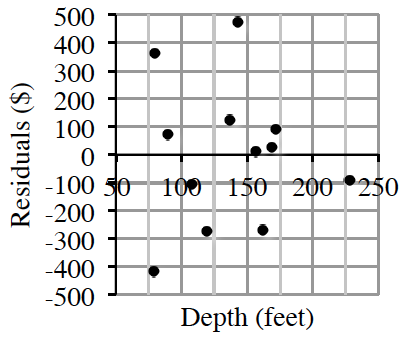
Is a linear model the best choice for predicting well cost using well depth? Support your answer.
Does the residual plot have a pattern? If so, another model might be better.