

Home > CCA > Chapter Ch6 > Lesson 6.1.1 > Problem 6-4
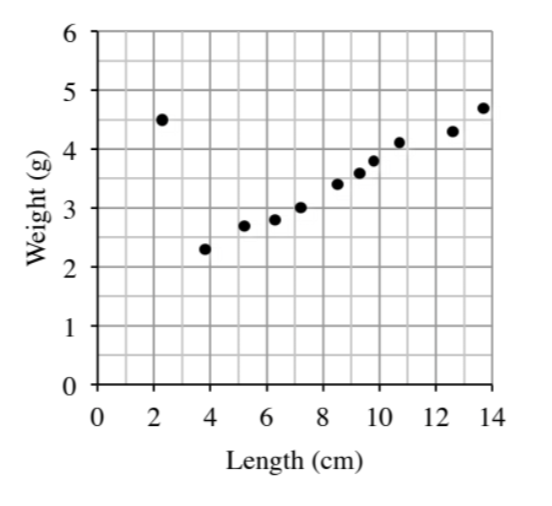
Sam collected data by measuring the pencils of her classmates. She recorded the length of the painted part of each pencil and its weight. Her data is shown on the graph at right.
Describe the association between weight and length of the painted part of the pencil. Remember to describe the form, direction, strength, and outliers.
What shape do the points on the graph form? This is the form. Be sure to describe the direction, strength, and outliers.
There is a strong positive linear association with an apparent outlier at
cm. Make a conjecture (a guess) about why Sam’s data had an outlier.
How could you change the outlying point to make it correspond with the other points on the graph.
Sam created a line of best fit:
where is the weight of the pencil in grams and is the length of the painted part on the pencil in centimeters. What does the slope represent in this context?
Which number in the given equation represents the slope? What would the units of the slope be in this situation?
An increase of
Sam’s teacher has a pencil where the painted part is
long. Predict the weight of the teacher’s pencil. Let
in the equation given in part (c). Interpret the meaning of the
-intercept in context.
The y-intercept in this situation is predicted to be
. What are the units for and ?
When the pencil is so short that there is no paint left, we predict that it will weigh