

Home > CCA2 > Chapter Ch11 > Lesson 11.1.2 > Problem 11-20
The term “curving” is often misused as it applies to test scores. Many believe it refers to adding points or otherwise adjusting test scores such that the highest paper is
A “curve” sometimes used is shown below:
Grade
D
C
B
A
Number of Standard Deviations Above or Below Mean
Minimum Percentile
nd th th th Using this curve, what percentage of students would earn each letter grade?
The following statistics are from problem 9-98, the test scores on Mrs. Abraha’s Chapter 3 test in Geometry. The mean was
, and the standard deviation was . If Mrs. Abraha used the curve in part (a), the minimum score for a B would be one standard deviation above the mean, or
. What would be the minimum test scores for the other letter grades on Mrs. Abraha’s test? mean (standard deviation) Shown at right is a histogram of the scores from Mrs. Abraha’s Chapter 3 test in Geometry. Is using the curve from part (a) reasonable to assign letter grades? What advice would you give
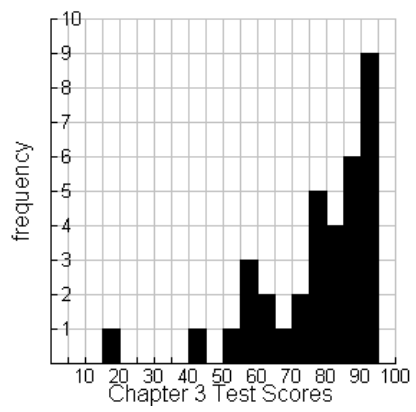
Using your answer to part (b), how many students would earn an A?