

Home > CCA2 > Chapter Ch5 > Lesson 5.2.3 > Problem 5-89
5-89.
Graph the two functions below on the same set of axes.
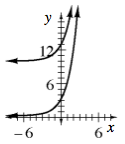
How do the two graphs compare?
Look at their y-intercepts.
The second graph is the first, but shifted
units upward. Suppose the first equation is
and the graph is shifted up units. What is the new equation? See part (a).