

Home > CCA2 > Chapter Ch9 > Lesson 9.1.2 > Problem 9-24
When vapor under high pressure is released into the air, the resulting noise can severely damage people’s hearing. This is a concern for large industrial facilities like power plants and factories. To help control this noise pollution companies install silencers, which work on the same principles as car mufflers. Hector is an engineer for Vapor Kinetics. He is testing two different models of silencers, the Hush Puppy and the Quiet Down, by measuring the sound energy in decibels (dB) each silencer is producing at various temperatures and pressures. The data has been sorted and is shown below:
Hush Puppy
Checksum | |||||||||
Quiet Down
Checksum | |||||||||
Create a combination boxplot and histogram for each silencer. For the histograms, scale the
-axis from to and use a bin width of dB. Use your graphing calculator or other statistical program to draw the histograms.
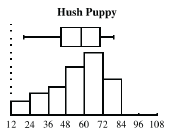
Describe the center, shape, spread and outliers for each silencer. Make sure your results have the same level of precision as the measurements.
Hush Puppy: The distribution is left skewed so its center and spread are best described by the median of
dB and IQR of dB; there are no apparent outliers. Hector needs to recommend one design for production. Which one do you suggest and why?
The decibel scale is logarithmic, not linear. For example, a
dB sound is times louder than a dB sound. This is roughly the difference in noise between running a kitchen blender and running a chain saw. Does this information change your answer to part (c)? Why or why not?