

Home > CCA2 > Chapter Ch9 > Lesson 9.3.3 > Problem 9-104
Do you remember the students tardy to Ms. Greene’s class? Now that you have investigated how to create and use a normal distribution, model the number of tardy students Ms. Greene actually recorded using a normal distribution. The data Mrs. Greene gathered for
Number of tardy students per day
|
|
|
|
|
|
checksum | |||||
You will need to use your calculator to complete this problem.
Click here for TI-83+/TI-84+ calculator instructions.
On your calculator, recreate the relative frequency histogram for the number of tardy students that is shown in problem
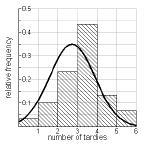
Find the mean and standard deviation of the number of tardy students.
On your calculator, model the data with a normal distribution by pressing


According to your model, on what percentage of days were
people tardy? Shade this proportion on a new sketch of the model, and calculate the proportion using normalcdf(lower, upper, mean, standard deviation) on your calculator. Be sure to sketch and shade the model. Assume that the last
days in Mrs. Greene’s class were representative of the days in the whole school year. According to your model, how many days this year can Mrs. Greene expect or more tardy students? Sketch the area representing these days on a new graph of the model. normalcdf(
)