

Home > CCG > Chapter Ch7 > Lesson 7.2.2 > Problem 7-71
On graph paper, graph and shade the solutions for the inequality below.
Example 1
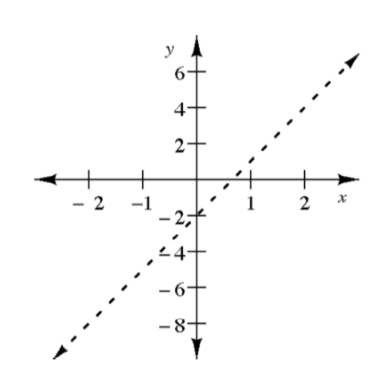
Graph the solutions to the inequality
First, graph the line
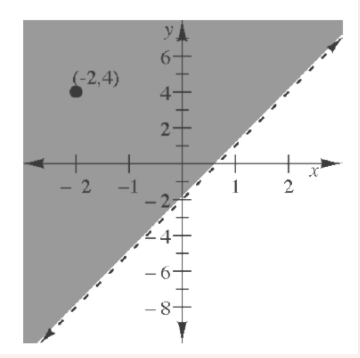
Next, test a point that is not on the boundary line.
For this example, use the point
Since the inequality is true for this test point, shade the region containing the point
Use the eTool below to graph and shade the solutions for the inequality.
Click the link at right for the full version of the eTool: 7-71 HW eTool