CPM Homework Banner
3-11.

Below is the graph of the function with tangents drawn at , , , and . Use the slopes provided in the graph to find the slope function . Notice that . It might be helpful to make a table of data relating to Slope at a Point eTool (Desmos)

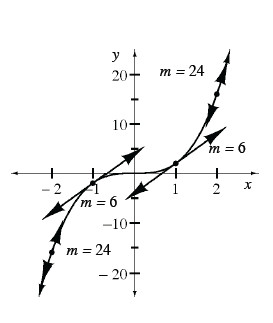
The data in the table was taken from the graph.
'' represents -values.
' ' represents slope of the tangent line.

The original graph, , is cubic. Does the table of slopes also appear to have a cubic pattern? If not, what type of function would model its pattern?

The slopes have a quadratic pattern! Clearly, the data does not fit the parent quadratic equation: . Find a transformation of that models the data.

Use the eTool below to view the tangent lines.
Click on the link to the right to view the full version of the eTool: Slope at a Point eTool