

Home > CALC3RD > Chapter Ch6 > Lesson 6.3.1 > Problem 6-89
6-89.
Sketch the graph of
Write the equation of the line tangent to the graph of
at its -intercept. 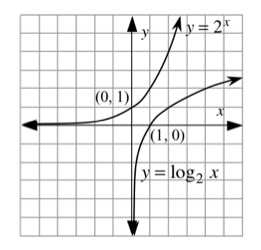
Use point-slope form.
Write the equation of the line tangent to the graph of
at its -intercept. Refer to the hint in part (a).
Graph both of these tangent lines. What is their relationship?
Sketch the tangent lines. Are they parallel? Are they perpendicular? Neither?
Look at their equations... describe a pattern you see in their slopes.Use the tangent line in part (a) to approximate the value of
when . Is your estimate an underestimate or an overestimate of the actual value? How do you know? Recall that the concavity of the graph determines whether tangent lines lie above or below the curve.