

Home > CALC3RD > Chapter Ch6 > Lesson 6.3.2 > Problem 6-98
6-98.
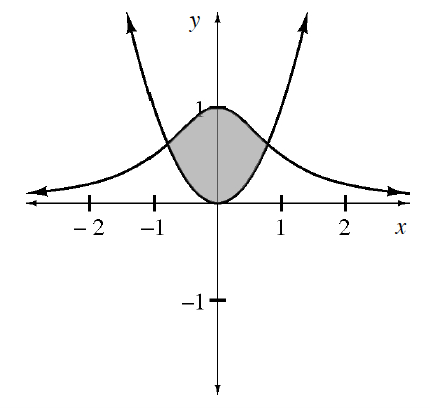
Calculate the area (shown in the diagram) between the graphs of
Identify which function is on top and which is on the bottom.
Calculate the area (shown in the diagram) between the graphs of
Identify which function is on top and which is on the bottom.