CPM Homework Banner
6-125.

For each graph below:

  1. Trace the curve on your paper and write a slope statement.

  2. Sketch the graph of the derivative using a different color.

  1. Curve coming almost vertical, from negative infinity about about, x = negative 1.2, turning at about (negative 1, comma 3), changing from concave down to concave up @ (0, comma 2), continuing to the right at about, y = 1.

  1. Curve coming from lower left, passing through the point (negative 4, comma 0), turning at the point (negative 2, comma 5), changing from concave down to concave up at (0, comma 2), turning at the approximate point (2.5, comma negative 2), continuing up & right, with additional x intercepts at 1 & 4.

  1. Periodic curve, x axis scaled from negative 5 to 5, with 4 visible approximate turning points at (negative 5, comma 3), (negative 1.75, comma negative 3), (1.5, comma 3), & (4.75, comma negative 3), passing through the origin.

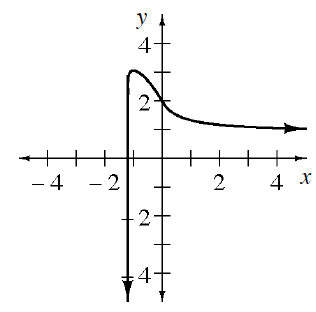
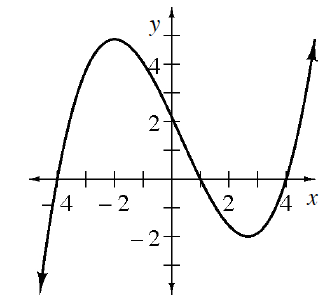
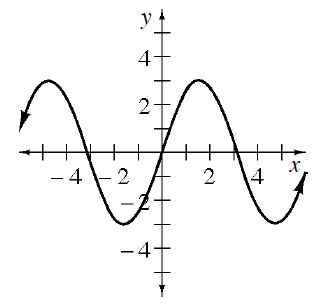
Slope statements should tell a story, starting at the left side of the graph and ending at the right side.
There should be a description of where the function is increasing or decreasing and how the rate in which it is increasing or decreasing is changing.

Steep positive slopes on the graph of should have very large -values on the graph of . Steep negative slopes on the graph of should have very large negative -values on the graph of . Maxima and minima on have tangent lines with slopes of , so they are roots on the graph of .