Home > CALC3RD > Chapter Ch6 > Lesson 6.4.2 > Problem 6-137
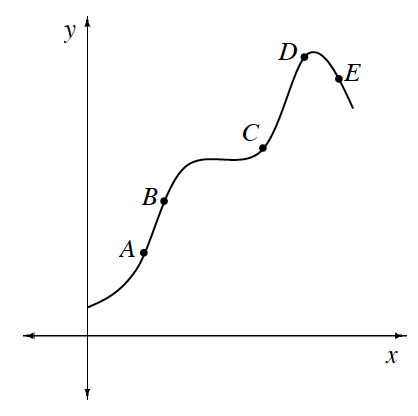
While answering the questions below, refer to the graph at right. Assume the axes are scaled equally. .
Between which pair of consecutive points is the average rate of change the greatest?
Average rate of change (AROC) can be seen on a graph as the slope of the secant line between two points.
At which point is the instantaneous rate of change closest to
? Instantaneous rate of change (IROC) can be seen on a graph as the slope of the tangent line at a specific point.
Which is greater: the average rate of change between
and or the instantaneous rate of change at ? Which is greater: the slope of the secant line or the slope of the tangent line?
Which is greater: the average rate of change between
and or the average rate of change between and ? Refer to the previous hints.
Use the eTool below to visualize the problem.
Click the link at right for the full version of the eTool: Calc 6-137 HW eTool