CPM Homework Banner
6-73.

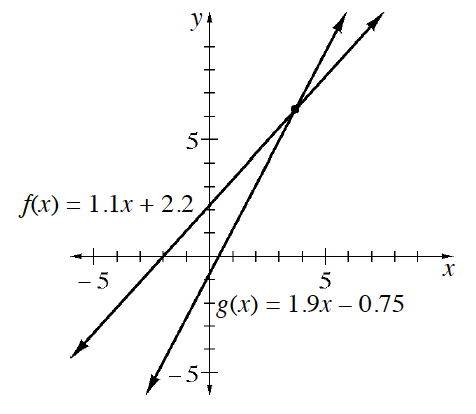
The graph below shows the lines and . One combination of input and output values will satisfy both functions. How do you know this? Use the graph to estimate this combination of values. Then create a table of values for each function and use it to justify your answer.  

2 increasing lines, intersecting approximately at the point (4, comma 6). Steeper line, labeled, f of x, = 1.1 x, + 2.2. Shallower line, labeled, g of x, = 1.9 x, minus 0.75.

What is the point at which the two lines intersect?

A reasonably close estimate is based solely on the provided graph.