Home > INT1 > Chapter Ch8 > Lesson 8.1.6 > Problem 8-86
Coach Ron has
Min | BPM | |
|---|---|---|
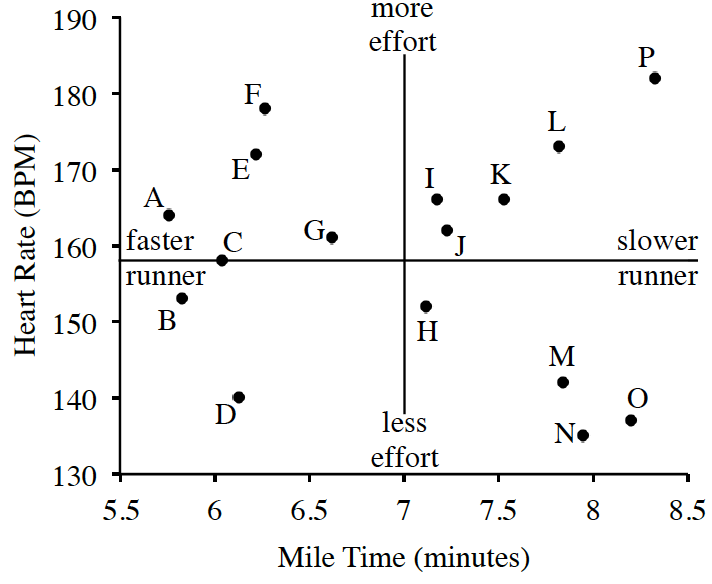
Ron’s assistant Cheryl believes they can still find something useful in the results. She proposes that if heart rates could be considered the level of effort given, some athletes might stand out as more or less desirable for the team. Cheryl divided the scatterplot into four quadrants and put the new labels on the axes. She also labeled each point. She drew the following scatterplot.
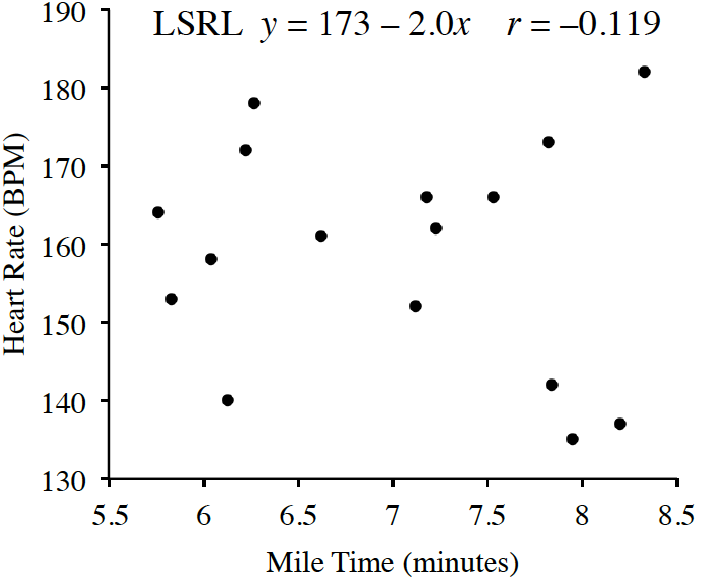
Describe the association to Coach Ron in detail.Is there any order to the data? Are there any outliers?
Coach Cheryl believes that the farther a player is from the center, the more they help or hurt the team. Give specific advice to Coach Ron about players
. Example:
- Ran a fast mile but seemed to be giving little effort. This athlete might already be in outstanding physical condition or have an attitude problem.
Give Coach Ron similar advice about player.