Home > INT3 > Chapter Ch4 > Lesson 4.3.2 > Problem 4-76
Some students at North City High are abusing the privilege of being allowed to leave campus for lunch. The number of students tardy to Ms. Greene’s period after lunch is too high. In the last
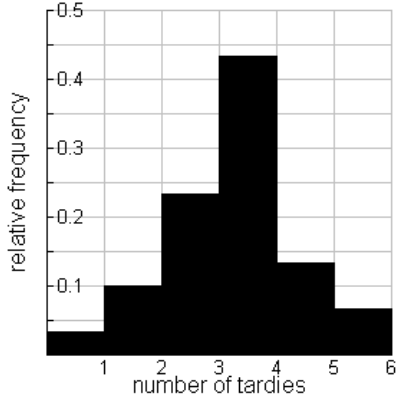
Describe the distribution of tardy students by estimating the height of each bin.
Review the Math Notes box in Lesson 1.2.3 on describing distributions.
The typical number of tardy students per day is _____ because...
The shape of the distribution is _____-peaked and _____.
The IQR (spread) of the distribution is _____.
There are/are not outliers.How many days were three or more students tardy?
Determine the number of days for each amount of tardies.
The height of the bin for
tardy is .
Therefore,days had only student tardy. What percentage of the days were no students tardy?
The height of the bin for
tardy is .
Therefore,of the days had student tardy.
What is the height of the bin fortardies? About
.