

Home > PC3 > Chapter Ch7 > Lesson 7.1.4 > Problem 7-54
7-54.
The graphs of
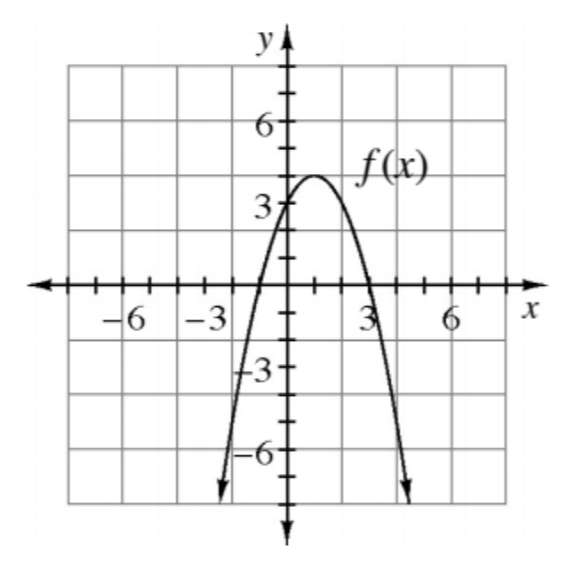
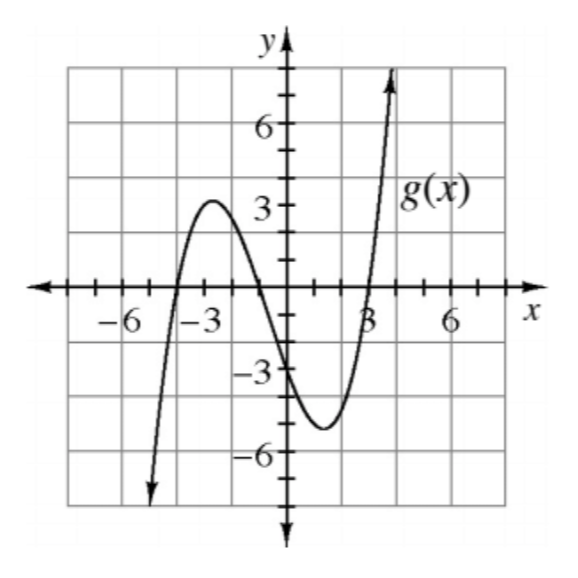
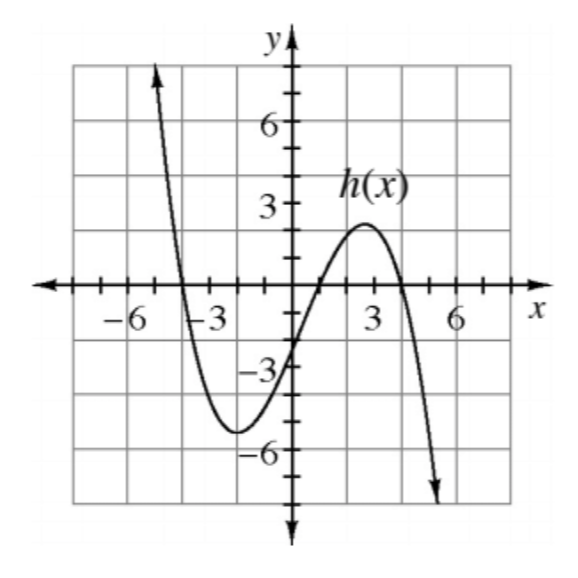
When
Sketch the reciprocal of the function that was not used in parts (a) or (b).
The graphs of
When
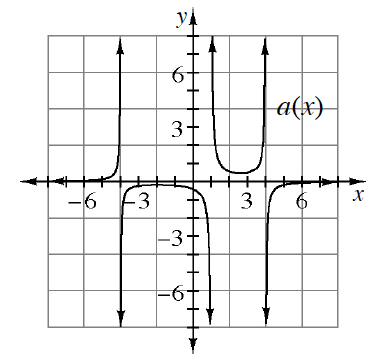
Sketch the reciprocal of the function that was not used in parts (a) or (b).