CPM Homework Banner

Home > PCT > Chapter Ch2 > Lesson 2.3.6 > Problem 2-144

2-144.

First quadrant graph, titled flow rate of water in a pipe, x axis labeled minutes, scaled from 0 to 50, y axis labeled gallons per minute, with curve starting at (0, comma 3), decreasing, opening down, changing to opening up at (20, comma 2), turning at (35, comma 1.5). The region below the curve, above the x axis, & between x, = 20, and, x = 50, is shaded.The graph at right shows the rate of water flowing through a pipe. 

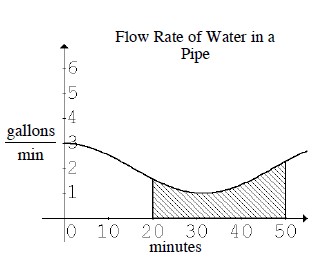
  1. What does the shaded region represent in terms of the pipe? Be specific and include the interval.

    Think of the definition of area and the units being used.

  2. Approximate the area using the correct units.

    The units are (gallons/minute)(minutes).