

Home > PCT > Chapter Ch6 > Lesson 6.2.3 > Problem 6-101
6-101.
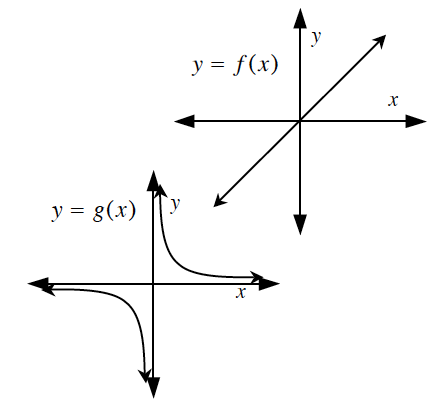
Copy the graphs of
Use graphical addition to sketch the graph of
. Make possible tables for each graph.
Add the-values to obtain . Make a reasonable guess for the equations
and . Use this to test your graph of . looks like . looks like .
Use the eTool below to help you visualize this problem.
Click the link at right for the full version of the eTool: 6-101 HW eTool