

Home > AC > Chapter Ch1 > Lesson 1.1.4 > Problem 1-34
1-34.
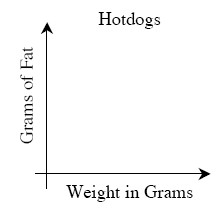
Copy the axes below onto your paper. Add an appropriate scale and then place and label a point on the graph for each of the products listed below.
Create ordered pairs for each hot dog before plotting.
Decide what information is your independent variable (
Dog-Eat-Dog has a supreme hotdog that weighs
grams and has grams of fat. Hot Doggies has a diet hotdog that weighs
grams and has only grams of fat. Dog-alicious has a cheap hotdog that weighs
grams and has grams of fat.
Use the eTool below to plot the points of the products listed.Click the link at right for the full version of the eTool: 1-34 HW eTool (Desmos)