

Home > MC2 > Chapter Ch5 > Lesson 5.3.1 > Problem 5-91
Edwin's friends guessed how many jelly beans were in a jar at his birthday party. Here are their guesses. .
Make a stem-and-leaf plot to display the data.
See problem 4-27 in the text or look in the glossary for how to make a stem-and-leaf plot.
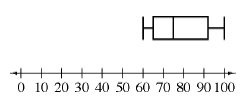
Make a box-and-whisker plot to display the data.
Refer to the Math Notes box in Lesson 4.2.4 for a reminder of box-and-whisker plots.
Which data display most clearly shows the median of the data? What is the median?
Which plot takes into account the median when it is being constructed?
Based on the box-and-whisker plot, estimate what percent of students guessed more than
jellybeans. Find
on your box-and-whisker plot. Is there any measurement of center in that area? What does that part of the box-and-whisker plot represent? What percentile is that? Notice that the lower quartile exists at around
guesses. The lower quartile is also representative of the 25th percentile. Approximately
of students guessed more than jelly beans. Use the stem-and-leaf plot to determine the actual percent of students who guessed more than
jellybeans. Determine how many students guessed over
jelly beans and how many students there were total.
Explore the problem with the eTool below.
Click the link at right for the full version of the eTool: MC2 5-91 HW eTool