Home > CCAA8 > Chapter 2 Unit 2 > Lesson CCA: 2.2.1 > Problem 2-48
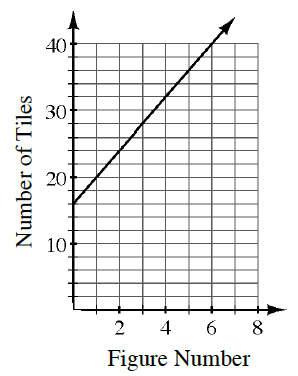
The graph below represents the number of tiles in a tile pattern.

Based on the information in the graph, how many tiles are being added each time (that is, what is the slope of the line)? Pay close attention to the scale of the axes.
You are being asked for the slope. Create a slope triangle.
Note that the-axis is scaled by s. How many tiles are in Figure 0?
Looking at the graph, what is the
-value when is ? Write the equation for the tile pattern.
Use the slope from part a and the
-intercept from part (a) to write the equation of the line in the form . How would the line change if the pattern grew by
tiles each time instead?
If Figure 0 had
tiles, Figure 1 would have tiles, Figure 2 would have tiles, etc.
What would this look like on the graph?