

Home > CC2 > Chapter Ch7 > Lesson 7.1.5 > Problem 7-57
Erika is tracking the depth of the water in her local creek. Her first twelve measurements are below, in inches.
Find the median, first quartile (Q1), and third quartile (Q3).
The median is the middle number of an ordered set of data.
Order the measurements in ascending order, from least to greatest. From both ends, count until you get to a middle number. Remember, if there are two middle numbers, the median is the average of the two.
Now find the median of the lower half (Q1) and upper half (Q3) of the data set. Note that if there are an odd number of data values, the median is not included in either half of the data set.
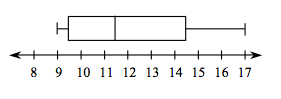
, , Create a box plot for the data. Read the Math Notes box in this lesson to review how to make a box plot.
What is the interquartile range (IQR) for Erika’s data?
Subtract Q1 from Q3 to find the IQR.