Home > CC3 > Chapter Ch9 > Lesson 9.2.1 > Problem 9-64
Use the graph at right to answer the following questions.
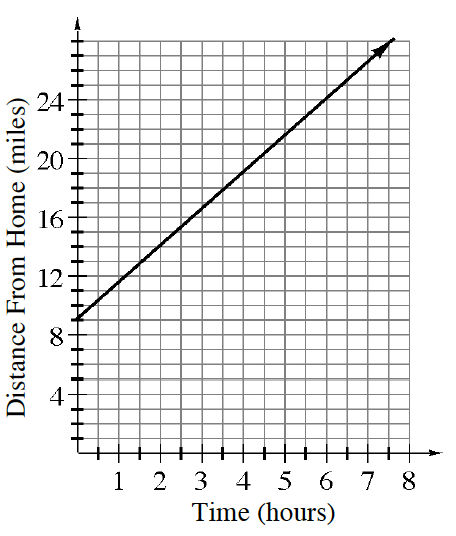
What kind of growth does this graph show? How do you know?
Does the graph show linear growth or non-linear growth? You can tell because linear growth creates a line.
What is this graph describing? Write an appropriate title for the graph.
Look at the
-axis and -axis labels. The graph shows the distance from home at several different time periods. Possible title: Distance and Time
How far from home is the person when the graph starts?
The graph starts at
hours. Which means this person just started to travel. What is the distance from home at hours? He starts at
miles from home. How fast is the person traveling? Explain how you can use the graph to determine the rate of travel.
Find the slope of the line.
Write an equation to represent the line on the graph.
A slope of
means that the distance from home increases miles per hour. That means we multiply and any hour which we will call . Since we know how fast this person is traveling, we also need to know the starting distance. From part (b) we found that this person started
miles away from home. relates to amount traveled every hour and relates to the starting point.