

Home > CC3 > Chapter Ch9 > Lesson 9.2.4 > Problem 9-119
9-119.
Make a table and graph the rule
Make the table first. Then plot points using the table. You will have to use decimal approximations for many of the
There will be no values for
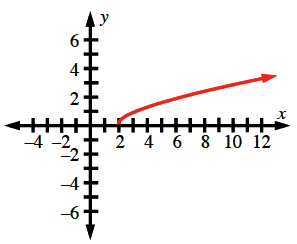
Make a table and graph the rule
Make the table first. Then plot points using the table. You will have to use decimal approximations for many of the
There will be no values for