Home > CC3 > Chapter Ch9 > Lesson 9.2.7 > Problem 9-153
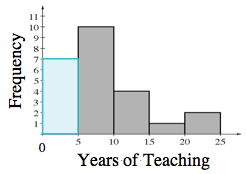
A principal made the histogram below to analyze how many years teachers had been teaching at her school. 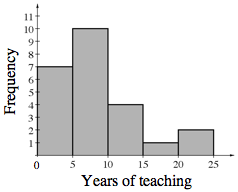
How many teachers work at her school?
Add up the frequencies represented by the bars. How many total teachers are there?
If the principal randomly chose one teacher to represent the school at a conference, what is the probability that the teacher would have been teaching at the school for
or more years? Write the probability in two different ways. Based on the histogram, how many teachers have been teaching for
years or more? 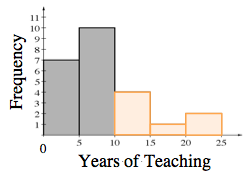
How can this probability be represented as a fraction and a percent?
What is the probability that a teacher on the staff has been there for fewer than
years? Based on the histogram, how many teachers have been teaching for less than
years?