

Home > CCA2 > Chapter Ch12 > Lesson 12.1.1 > Problem 12-17
12-17.
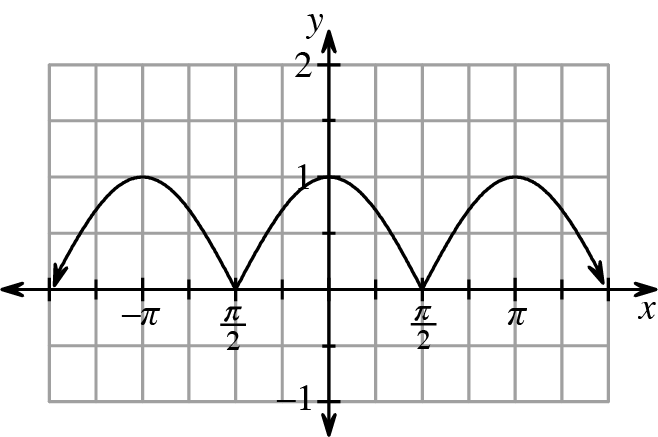
Using a graph of
How does the absolute value change a value?
How would this change look on a graph?
Using a graph of
How does the absolute value change a value?
How would this change look on a graph?