

Home > CCA2 > Chapter Ch8 > Lesson 8.3.1 > Problem 8-126
Checksum | |||||||||||||||
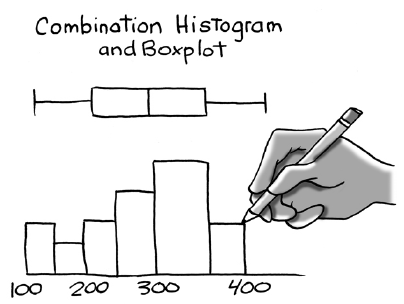
Create a combination boxplot and histogram. Use an interval of
to pounds on the x-axis and a bin width of pounds. The distribution has a right skew and an outlier at
pounds so the center is best described by the median of pounds and the spread by the IQR of pounds. Describe the center, shape, spread and outliers.
What is a better measure of center for this distribution the mean or median and why?
The median is better in this case because it is not affected by skewing and outliers.
What is a better measure of spread the standard deviation or IQR and why?
The IQR is better in this case because it is less affected by skewing and outliers than the standard deviation.
The city can sell the compost, and engineers estimate the program will be profitable if each home averages at least
pounds of material. The city manager sees the mean is nearly pounds and is ready to order dumpsters for every residence. What advice would you give him? Removing the outlier from the data drops the mean to
pounds which is below the profitable minimum. Suggest running the test a few more weeks. Perhaps as people get used to the composting program, they will participate more.
Use the eTool below for help with this problem.
Click on the link at right for the full eTool version: CCA2 8-126 HW eTool