

Home > CC1 > Chapter 8 > Lesson 8.1.4 > Problem 8-56
How do box plots help compare data? Think about this question as you compare the data below that shows the ages of students at three schools.
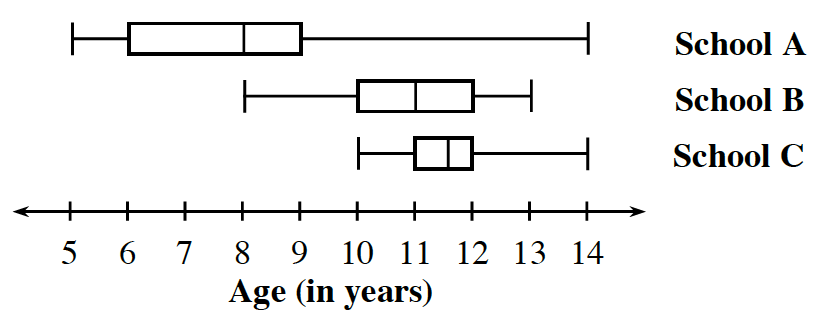
Which school is a K-8 school? How do you know? Does that school have more students in grades K-2, 3-5, or 6-8? Why?
Look at the plots. Which school's plot has the largest range? What does this tell you about the students that attend that school?
What does the box plot for School C tell you about 11-year-old students at that school?
Think about how these types of plots are drawn.
Which portion of the plot would tell you about 11-year-old students?11-year-olds are 50% of School C's population.
How many students attend School C?
Can you determine from these kinds of plots the total number of students?
The number of students cannot be determined from this plot.
Make a conjecture about how the data for these plots was collected.
Think about how one would get this kind of information from each of these schools.
What statements can you make about the students at School B based on its box plot? Consider the center, shape, spread, and outliers.