Home > CC1 > Chapter 8 > Lesson 8.1.5 > Problem 8-67
8-67.
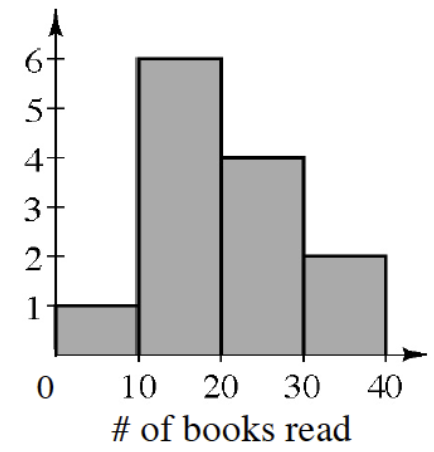
Create a histogram of the data from problem 8-66. What are the advantages and disadvantages of displaying the data using a histogram?
What does a histogram allow you to visually determine that other plots do not?
Compare the histogram with the stem-and-leaf plot from problem 8-66.