

Home > CC1 > Chapter 8 > Lesson 8.2.1 > Problem 8-83
Levi used the box plot below to say, “Half of the class walked more than
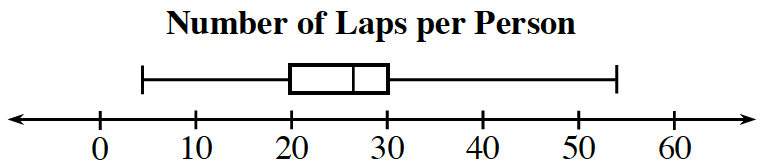

laps? If half of the class walked more than thirty laps, then the median would be at
.
Levi wants to describe the portion of students who walked between
and laps (the box). What statement could he say? The portion of students who walked between
and laps is the interquartile range.
What percentage of the students does this represent?How could you alter a single data point and not change the graph? How could you change one data value and only move the median to the right?
You could change one of the data points between
and the maximum, but keep in the same range of values.
You could add data greater than the current median.Can you determine how many students are in Levi’s class? Explain why or why not.
No, you cannot determine this information from the data in the box plot.