

Home > CC1 > Chapter 9 > Lesson 9.1.1 > Problem 9-12
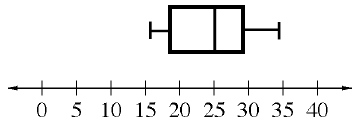
Lucy and Marissa each designed a box plot to represent this data set:
Their plots are shown in part (a) below.

Which plot is scaled correctly and why? Explain the mistakes in the incorrect plot.
What are the characteristics of a number line?
A number line should be spaced evenly with ascending numbers from left to right.
(i.) is correct because the number line is equally spaced with numbers that ascend by
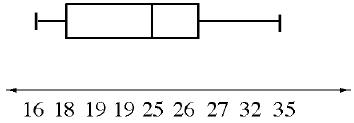
's evenly. (ii.) is incorrect because the number line is labeled incorrectly.
There are two number's, some are increasing by one while others are increasing by three, etc.
Determine the first and third quartiles, the median, and the Interquartile Range (IQR) for this data set.
Read from the correct plot you chose from part (a):
First Quartile,
Third Quartile,
Median,
IQR