CPM Homework Banner

Home > CC2 > Chapter 2 > Lesson 2.1.2 > Problem 2-29

2-29.

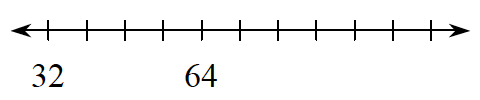
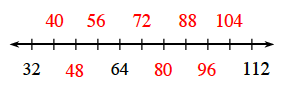
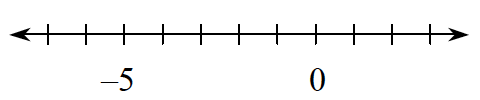
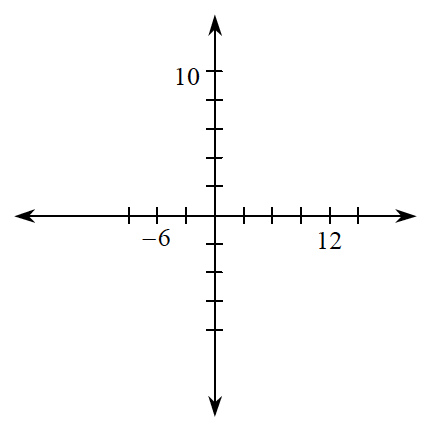
Copy the graphs below onto your paper. Then complete the scale by labeling the remaining tick marks.  

Scaling Axes

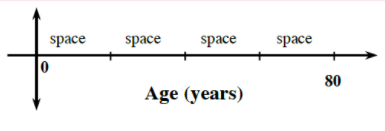
The numbers on each axis of a graph or a number line show the scaling of the axes. The difference between consecutive markings tells the size of the interval. When you scale each axis, you must use equal intervals to represent the data accurately. For example, an interval of creates a scale numbered , , , , , , , etc. Unequal intervals distort the relationship in the data.

Notice on the graph at right that marks the end of the fourth interval from zero. If you divide years by you can see the length of an interval on this graph is .

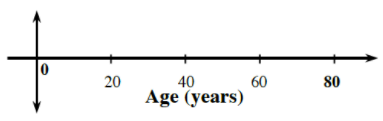
The second graph at right has each interval labeled. Labeling the graph this way is called “scaling the axis.”

The x-axis labeled, age in years, with 4 tick marks right of 0, fourth labeled 80, and interval between tick marks, labeled space.

Same x axis, tick marks labeled as follows: 20, 40, 60, 80.

  1. A number line with 11 marks, labeled, starting at the left, as follows: first, 32, fifth, 64.

    Number line labeled, from left to right, as follows: 32, 40, 48, 56, 64, 72, 80, 88, 96, 104, 112.

  1. A number line with 11 marks, labeled, starting at the left, as follows: third, negative 5, and eighth, 0.

  1. Coordinate plane: x axis has 3 marks left of the y axis, and 5 marks right of the y axis, labeled, starting at left, as follows: second, negative 6, fourth, y axis, eighth, 12.  Y axis has 5 marks above the x axis, and 4 marks below the x axis, labeled, starting at the bottom, as follows: fifth, x axis, tenth, 10.