

Home > CC2 > Chapter 7 > Lesson 7.1.3 > Problem 7-38
Read the Math Notes boxes in this lesson and in the previous lesson. Use the information to complete the following problems.
The coach of the fifth grade girls basketball team measured the height of each player. Their heights in centimeters were
Make a stem-and-leaf plot of the players’ heights.
A stem-and-leaf plot displays data by ordering it least to greatest. All of the digits except for the last one form the stem and the last digit forms the leaf. The leaf portion is arranged in order from least to greatest.
Make a histogram of the players’ heights.
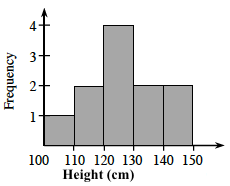
Describe the shape and spread of the data. That is, is it symmetric or non-symmetric? Does it have more than one peak or only one? Is it tightly packed together or widely spread out?
Is the data symmetric? How many peaks does it have? Is it closely packed or spread out?
Does this data have any outliers? Which measure of center, mean or median, would be appropriate to use to describe the typical heights?
The median is the middle number in a set of data, and the mean is the average of all the numbers in a set of data.
What is the typical height of a player on the team?
What is the median and what is the mean in the given set of data?
What is the range of the data?
The range is the difference between the greatest and least number in a set of data.
Subtract the smallest number from the largest number.
Explore the problem with the eTool below.
Click the link at right for the full version of the eTool: 7-38 HW eTool