

Home > CC3 > Chapter 2 > Lesson 2.1.6 > Problem 2-62
2-62.
The graph below shows distances traveled by Car A and Car B. Car A is represented by the line containing point A, and Car B is represented by the line containing point B. Use the graph to answer the following questions.
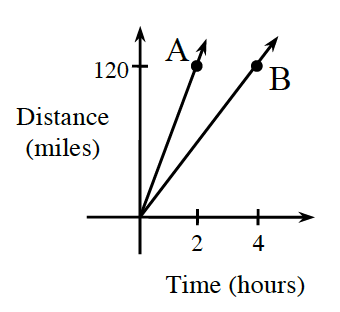
Which car is traveling faster? How can you tell?
Look at the slopes of the lines.
Car A, because its line is steeper.
Find the coordinates of point A and point B.
Look at the graph.
How fast did Car A travel (in miles per hour)? How fast did Car B travel?
Speed is equal to distance divided by time.
Does the distance Car A has traveled vary directly with the time? Why or why not?
Yes, because the graph of Car A is a straight line through the origin.