

Home > CC3 > Chapter 6 > Lesson 6.2.5 > Problem 6-96
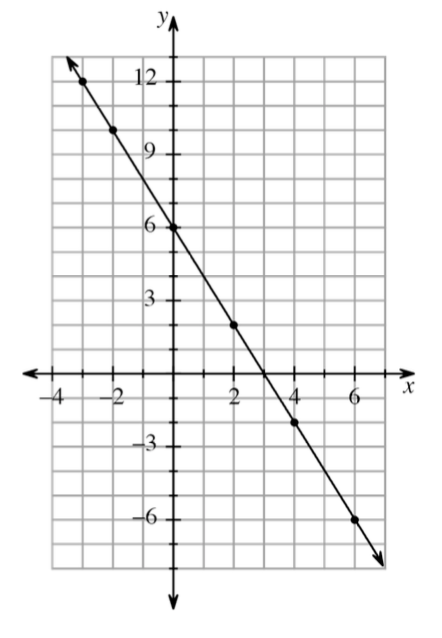
Use the graph below to add points to the table below.
x column 1 is blank. | x column 2 is blank. | x column 3 is blank. | x column 4 is blank. | x column 5 is blank. | x column 6 is blank. | x column 7 is blank. | |
y column 1 is blank. | y column 2 is blank. | y column 3 is blank. | y column 4 is blank. | y column 5 is blank. | y column 6 is blank. | y column 7 is blank. |
For each point, find its
x column 1 | x column 2 | x column 3 | x column 4 | x column 5 | x column 6 | |
y column 1 | y column 2 | y column 3 | y column 4 | y column 5 | y column 6 |
Write the rule in words.
Notice that for every
the -value increases, the -value decreases by . Also take into account the value for the -intercept. Multiply
by and then add . Explain how to use the table to predict the value of
when is . Extend the pattern in the table. Answers may vary.