

Home > CCA > Chapter 1 > Lesson 1.2.1 > Problem 1-38
Chari performed a series of jumps on a trampoline. Her coach measured the height of each jump. The coach’s data was recorded in the table at right.
Make a graph of the data.
Complete the table in the eTool below to graph the data.
Click the link at right for the full version of the eTool: CCA 1-38 HW eTool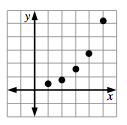
Fully describe the graph.
Look carefully at your graph. What is happening with the data? How is it changing?
If this pattern continues, what are a reasonable maximum and minimum for the graph?
What is the highest Chari can jump? What is the lowest?
Which family of functions could model this data? Review the Lesson 1.1.2 Math Note if you need help.
Look at the Math Notes below for help with this problem.
Families of Functions
There are several “families” of special functions that you will study in this course. One of these is called direct variation (also called direct proportion) which is a linear function. The data you gathered in the “Sign on the Dotted Line” lab (in problem 1-9) is an example of a linear relation.
Another function is inverse variation (also called inverse proportion). The data collected in the “Hot Tub Design” lab (in problem 1-9) is an example of inverse variation.
You also observed an exponential function. The growth of infected people in the “Local Crisis” (in problem 1-9) was exponential.
Note that we will define and develop these and other functions later in the course, and formally introduce functions in Section 1.2 of this chapter.
Jump | Height |
|---|---|