CPM Homework Banner

Home > CCA > Chapter 10 > Lesson 10.2.5 > Problem 10-87

10-87.

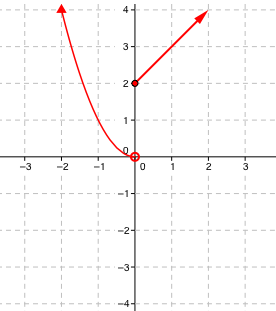
In Chapters 2 and 6 you saw some examples of piecewise graphs. At right is an equation for a piecewise graph.                          

This equation states that for non-negative input values the top rule is used and for negative input values, the bottom rule is used.

For example, for an input of , the output is and therefore the point is on the graph. However, for an input of , the output is and therefore the point is on the graph. Use various other input values and sketch a graph of this piecewise function.   

Complete the table in the eTool below to create a graph of the piecewise function.
Click the link at right for the full version of the eTool: CCA 10-87 HW eTool

A piecewise graph with two parts. The left part is the left half of the upward parabola y = x squared starting with an open circle on the origin and extending left and up. The right part of the graph is the line y = x + 2 starting with a closed circle at (0, comma 2) and extending up and right.