Home > CCA > Chapter 2 > Lesson 2.2.2 > Problem 2-67
2-67.
Each part (a) through (d) below represents a different tile pattern. For each one, determine how the pattern is growing and the number of tiles in Figure 0.
tile
tile
tile
tile
tile
tile
tile
tile
tile
tile
tile
tile
tile
Figure 2
tile
tile
tile
tile
tile
tile
tile
tile
tile
tile
tile
tile
tile
tile
tile
tile
tile
tile
Figure 3
tile
tile
tile
tile
tile
tile
tile
tile
tile
tile
tile
tile
tile
tile
tile
tile
tile
tile
tile
tile
tile
tile
tile
Figure 4
How many more squares does Figure 3 have than Figure 2?
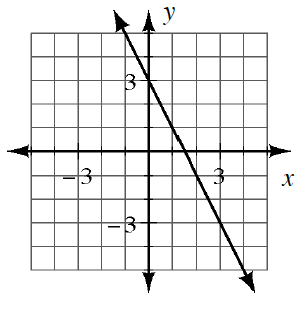
Make a slope triangle between two points on the graph to find the slope, or the growth rate.
Growth rate:
Number of tiles in Figure 0:
What is the difference between each
-value?
What is the value ofwhen is ?