

Home > CCA > Chapter 6 > Lesson 6.1.4 > Problem 6-35
Charlie’s friend is visiting from Texas and asks him, “What does a hamburger cost in this town?” This caused Charlie to wonder because the price of a hamburger seems to be different at every eatery. Charlie thinks there may be an association between the amount of meat in the patty and the cost of the hamburger. He collected the following data.
Meat (oz) | Cost ($) |
|---|---|
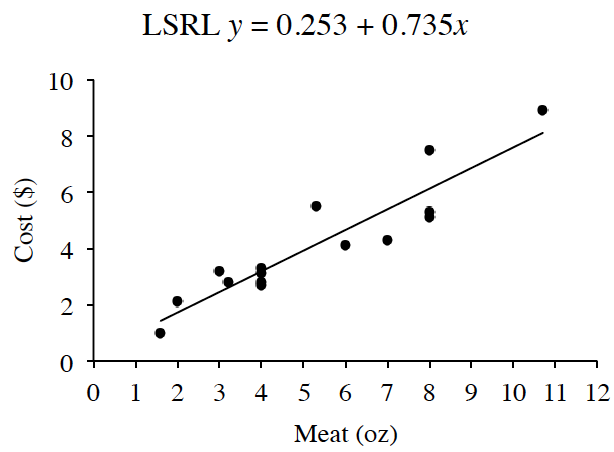
Interpret the slope and
-intercept in context. Does the -intercept make sense in this situation? The slope means that for every increase of
ounce in the patty size you can expect to see a specific price increase. The -intercept would be the cost of the hamburger with no meat. For every increase of
ounce in the patty size there is a price increase of . The -intercept of would be the cost of the hamburger with no meat. The -intercept seems low for the cost of the bun and other fixings, but is not entirely unreason
What is the residual for the hamburger with the
ounce patty? What does it mean in context? Calculate the predicted cost of a
ounce patty and subtract it from the actual cost of a ounce patty. One would expect to pay
for a burger with a oz patty while the cost of the given oz patty is , so it has a residual of . The oz burger costs more that predicted by the graph. Charlie’s friend says that in his home town he can buy a
pound hamburger for . Would this be a reasonable price in Charlie’s town? Show how you know.
Follow the same steps as part (b) to find the answer.