

Home > CCA2 > Chapter 1 > Lesson 1.2.1 > Problem 1-66
1-66.
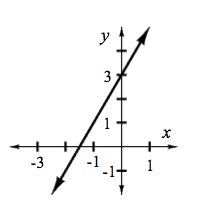
Graph the following functions and find the
To draw the graph, make a table of values. Be sure to include some negative values for
. Or you can refer to the Math Notes box in Lesson 1.1.2. The -intercept is easy to see in the table and on the graph. To calculate the -intercept, what value should you substitute for ?
How are the functions in (a) and (b) the same? How are they different?
Are the values in the table different?
Graph the functions in the eTool below to determine how they are the same and different.
Click the link at right for the full version of the eTool: 1-66 HW eTool