Home > CCA2 > Chapter 1 > Lesson 1.2.4 > Problem 1-112
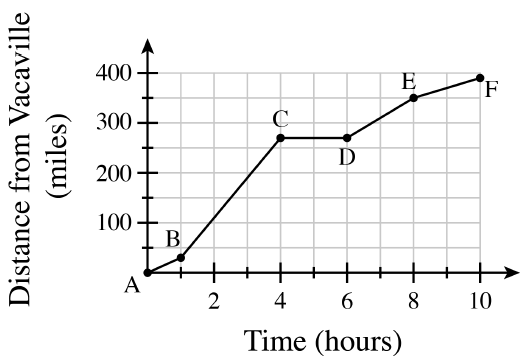
Explain what each line segment in the graph represents.
Are they traveling at the same speed all throughout the trip?
A portion of the trip at a specific speed.
About how many miles is it from Vacaville to Los Angeles? How do you know?
Which axis represents distance (measured in miles)?
About
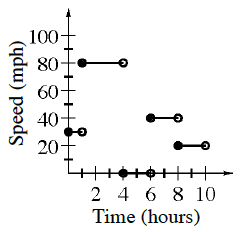
miles. Using the graph shown above, sketch a graph that would represent their speed while traveling. Take your time to think this through carefully and be sure to label the axes.
To find the speed in miles per hour for a portion of the trip, divide the number of miles traveled in that portion by the number of hours it took to travel that portion.
Graph shown below—a speed of approximately
mph for hour, approximately mph for the next hours, mph for hours, approximately mph for hours, and then approximately mph for the last hours. Note that the step graph assumes instantaneous change of speed, which is not technically possible.