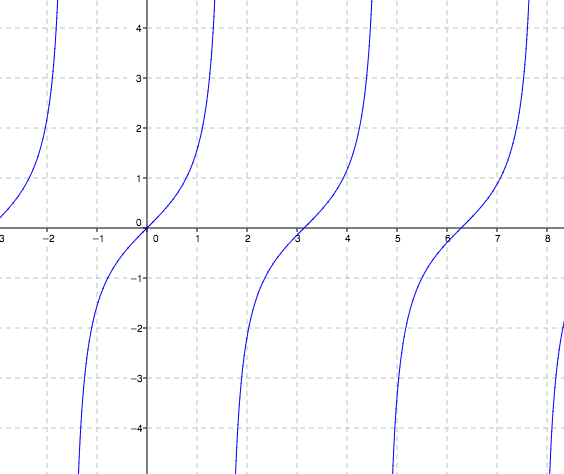
CPM Homework Banner
12-31.

Graph tan .

Here is the original graph of tan.
Repeating increasing curves, with first visible curve, contained within vertical asymptotes, negative pi halves & pi halves, changing from opening down, to opening up, at the origin. Additional visible curves cross the x axis at pi & 2 pi.

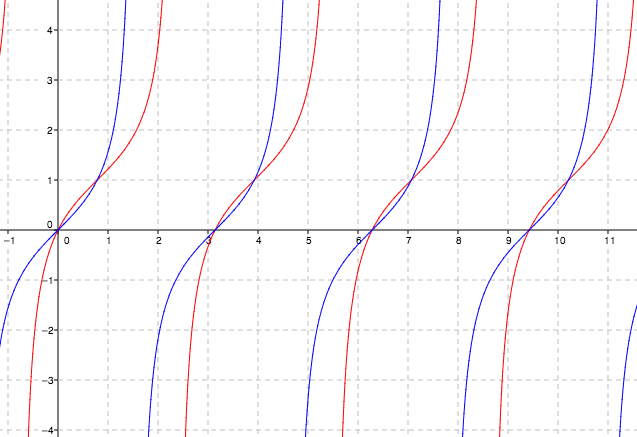
How does adding shift the graph?

How does subtracting   from  shift the graph?

Added to graph, repeating increasing red curves, with first visible curve, contained within vertical asymptotes, negative pi fourths & 3 pi fourths, changing from opening down, to opening up, at the point, (pi fourths, comma 1). Additional visible curves cross the x axis at pi, 2 pi, & 3 pi.