

Home > CCA2 > Chapter 4 > Lesson 4.2.1 > Problem 4-66
4-66.
Solve the following inequalities and draw a number line graph to represent each solution.
Solve the corresponding equations to determine the boundary points.
Solving yields
or .
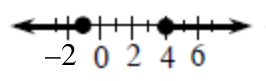
Plot these points on a number line.Test a point in each region on the number line in the original inequality. Highlight the region(s) where the test point makes the inequality true.
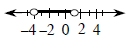
See the steps in part (a).
The boundary points in part (b) are the same as the ones in part (a). When you test a value between the boundary points you get a false statement.
See the steps in part (a).
Describe any relationships you see among these six problems.
How are the graphs of the 'less than' inequalities related to the graphs of the 'greater than or equal to' inequalities?