

Home > CCA2 > Chapter 6 > Lesson 6.2.1 > Problem 6-98
6-98.
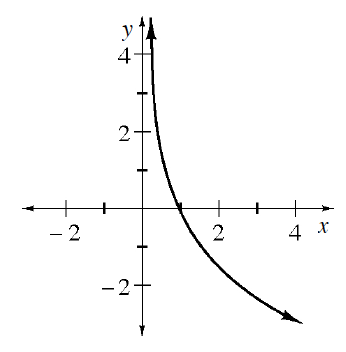
Below is a graph of
Think of the graph of
How would that affect the equation?
What is the maximum that
Use the eTool below to see how different values of b change the graph.
Click the link at right for the full version of the eTool: 6-98 HW eTool